



Imagine two investors beginning with exactly the same thing: ten ounces of gold.
The first puts his gold away and forgets about it. Twenty years later, he still owns ten ounces. The price may have risen considerably, but measured in gold, nothing has changed.
The second watches the relationship between gold and silver. Gold becomes unusually expensive relative to silver, he exchanges part of his gold for silver. Years later, when silver has become expensive relative to gold, he switches back.
Suppose the first exchange happens at a gold-silver ratio of 100 and the second at 50. Ten ounces of gold become 1,000 ounces of silver. Those 1,000 ounces later buy twenty ounces of gold.
Both investors started with ten ounces. Neither contributed another pound. One still owns ten. The other owns twenty.
There are transaction costs, taxes and the much harder problem of recognising the turning points. Markets rarely give examples this cleanly. But the math is useful. For an investor accumulating precious metals, wealth does not always have to be measured in currency. It can also be measured in ounces.
A Price That Is Not a Price
The gold-silver ratio is one of the oldest measurements in finance. The calculation could hardly be simpler: divide the price of one ounce of gold by the price of one ounce of silver. Gold at $4,000 and silver at $50 produces a ratio of 80. One ounce of gold has the same market value as 80 ounces of silver.
For thousands of years, this relationship was unusually stable. When gold and silver circulated alongside one another as money, governments frequently fixed their exchange rates. Rome used a ratio around 12:1. The United States adopted 15:1 under the Coinage Act of 1792. Across long stretches of history, ratios between roughly 12 and 15 were common.
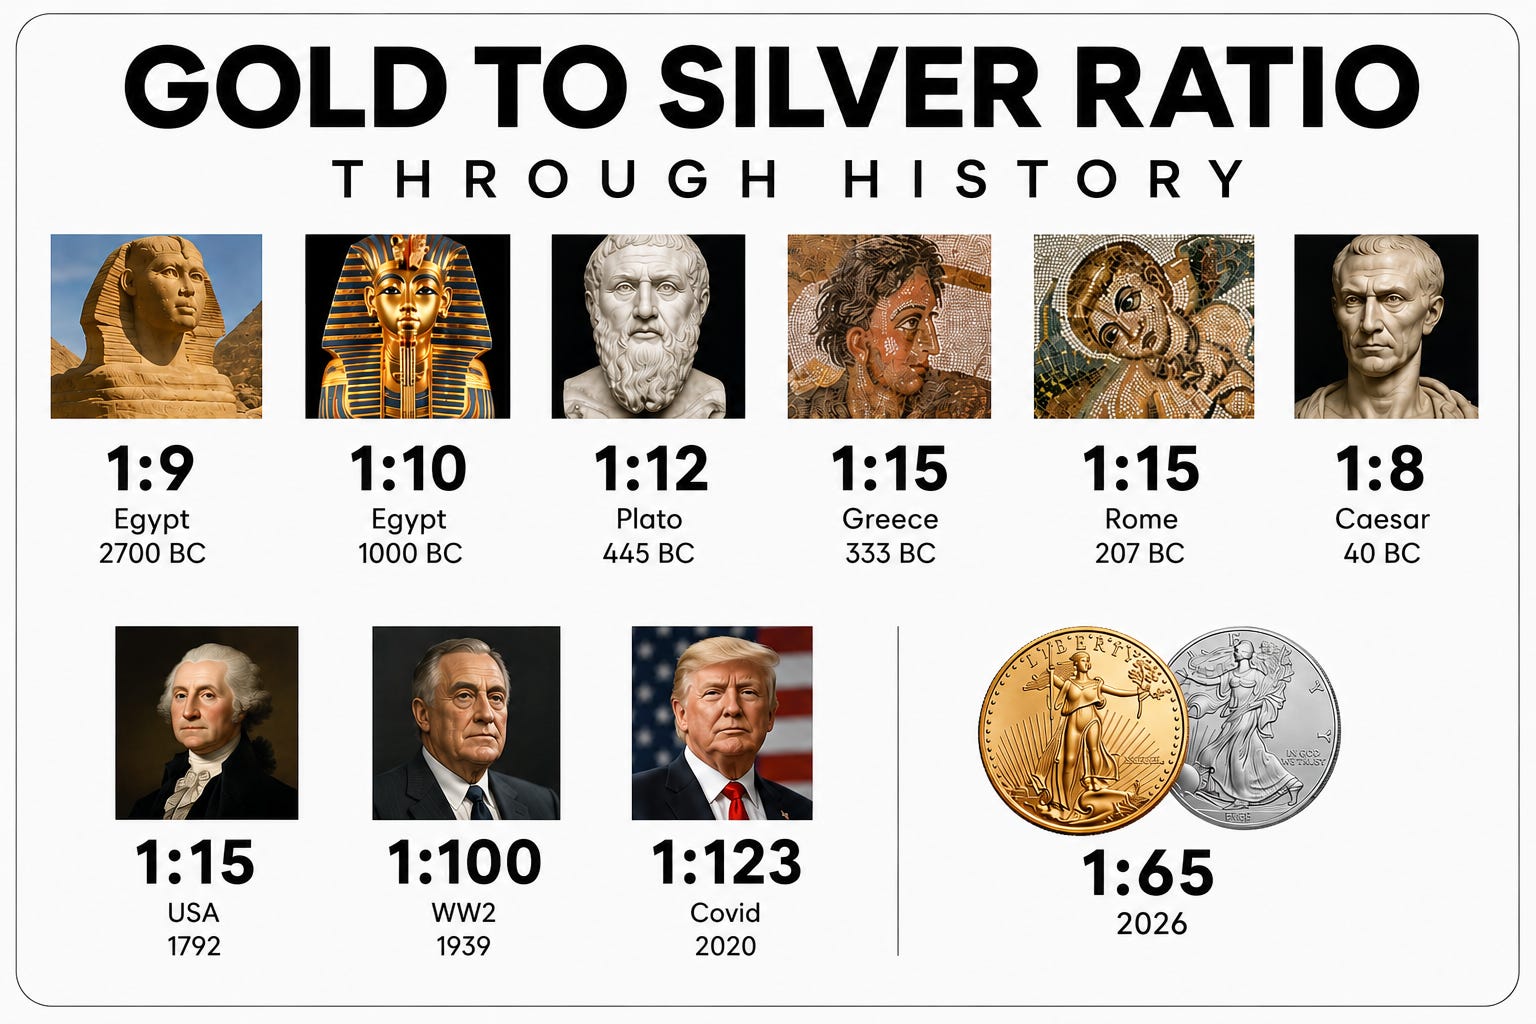
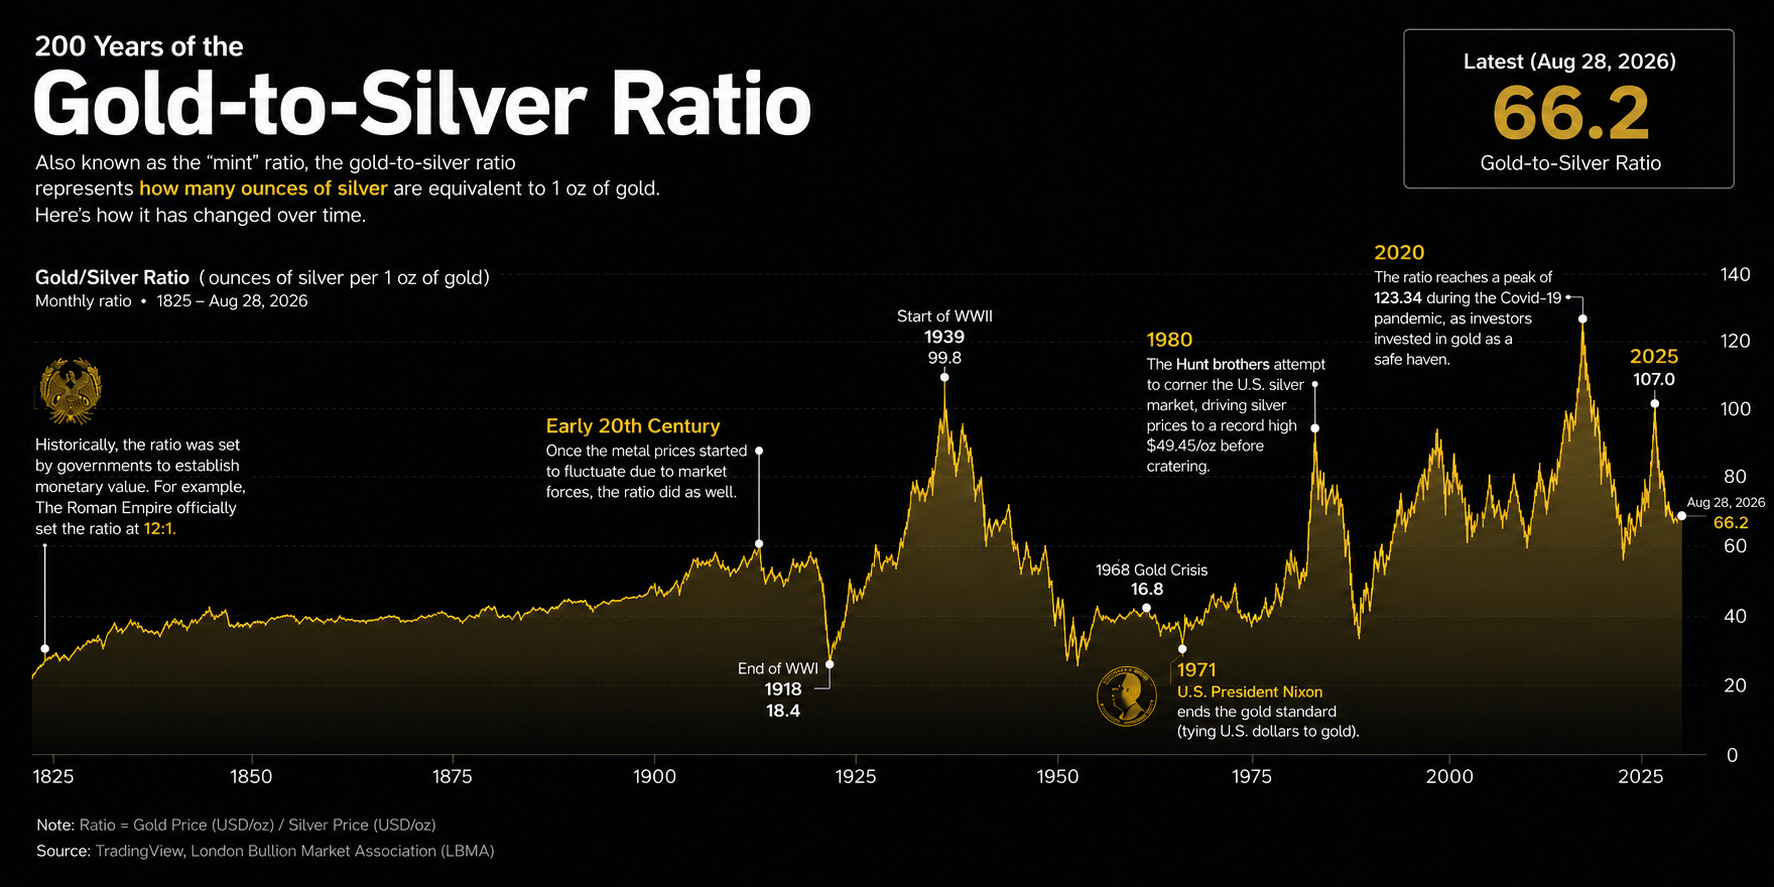
That world disappeared during the nineteenth century as major economies abandoned bimetallism and silver gradually lost its formal monetary role. Germany moved towards the gold standard after 1871, the United States demonetised the standard silver dollar in 1873 and other industrial economies followed. By 1900, the ratio had risen to roughly 34.5:1.
Today, the two metals serve very different purposes. Central banks collectively hold tens of thousands of tonnes of gold while holding virtually no silver reserves. Silver, meanwhile, has become an increasingly important industrial material used across electronics, solar panels, vehicles and electrical infrastructure.
The ratio is no longer anchored by governments. It moves according to two metals responding differently to monetary conditions, industrial demand, fear and speculation.
That instability creates the opportunity.
Why the Ratio Keeps Moving
The strategy depends on gold and silver refusing to behave identically.
Gold remains predominantly a monetary asset. Central banks accumulate it, investors buy it during periods of financial stress and relatively little annual demand comes from industrial consumption.
Silver has a split personality. Investment demand still responds to many of the forces that move gold, but industrial demand connects it to manufacturing, electronics, solar power and the economic cycle. Silver is also a smaller market and historically far more volatile.
The result can be violent movements in the ratio. During severe financial stress, gold can outperform as investors seek monetary safety while industrial concerns weigh on silver. The ratio rises. When precious metals markets broaden and silver begins catching up, the movement can reverse quickly.
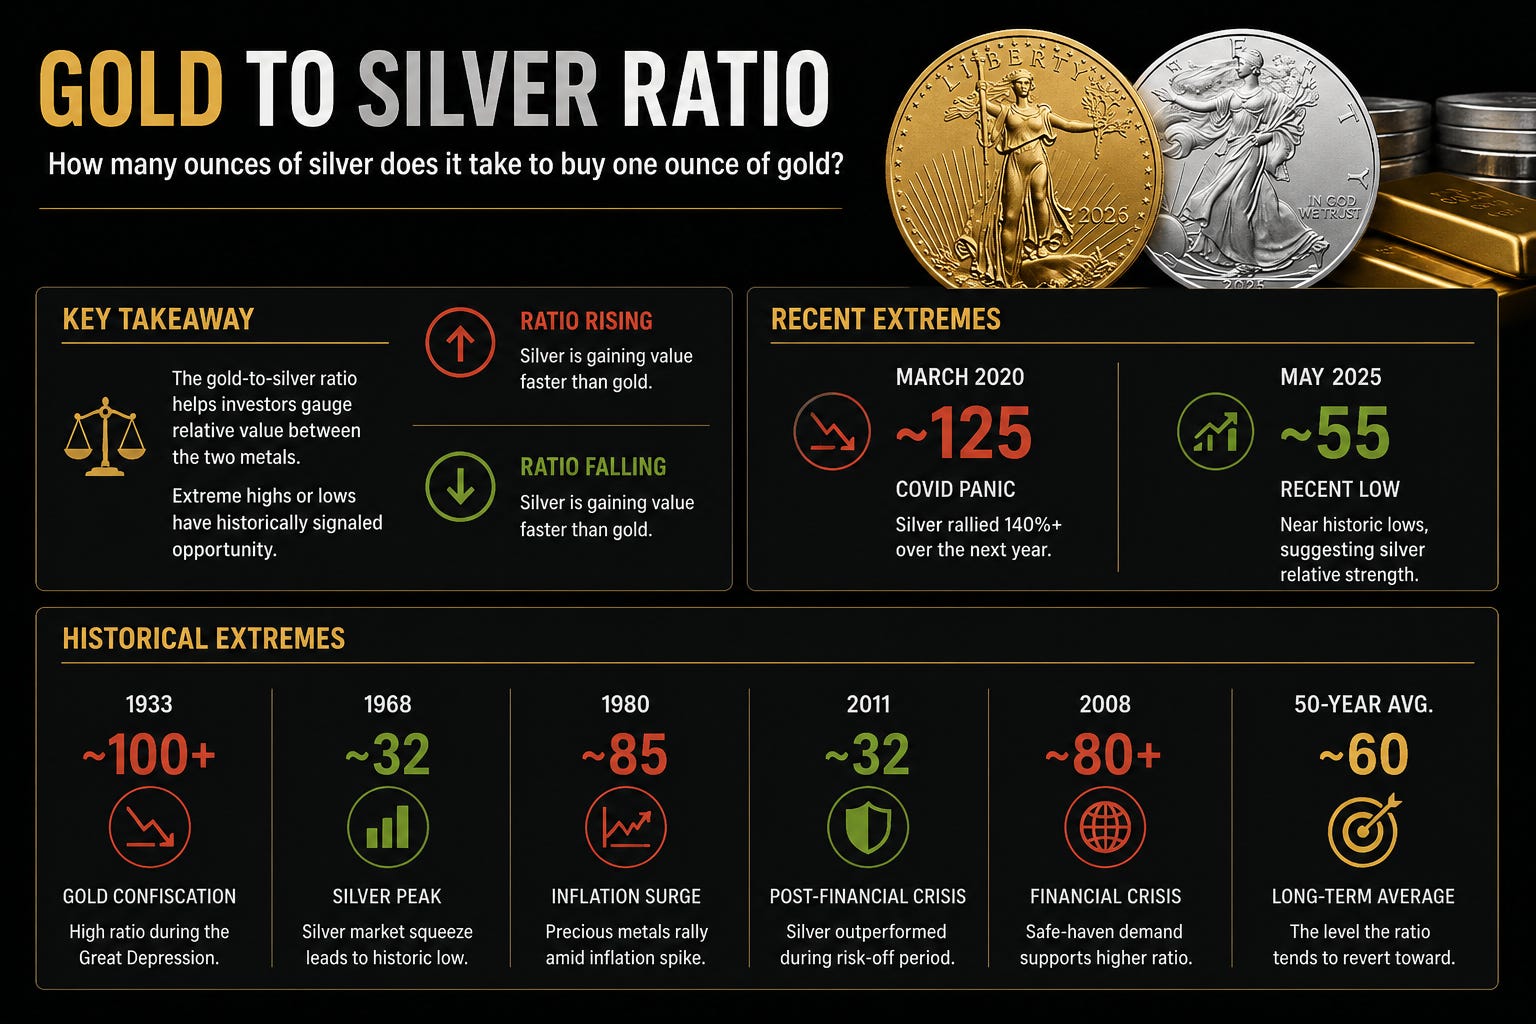
March 2020 offered the extreme version. The ratio reached roughly 125.7 as silver collapsed during the pandemic panic. By comparison, the great silver advances of 1980 and 2011 drove the ratio towards roughly 15 and 30 respectively.
Anyone attempting to use the ratio has to accept that these historical extremes are observations, not laws. A ratio of 80 does not mechanically make silver cheap. A ratio of 50 does not automatically make gold attractive.
Markets have no obligation to return to an old average.
The Cost Problem
Then there is the problem of transaction costs.
Try repeatedly switching physical coins and bars between gold and silver and the mathematics deteriorate quickly. Dealer premiums, buy-sell spreads, storage and the practical inconvenience of moving physical metal all consume ounces with every transaction.
Repeatedly switching between physical gold and silver is therefore considerably less efficient than the worked example suggests.
Goldwise changes some of that.
Goldwise currently charges 0.50% on fractional precious metal buy and sell transactions, compared with the roughly 4–8% transaction costs investors can encounter when buying and selling physical coins and bars. Lower transaction costs reduce the movement in the ratio required before a switch becomes worthwhile. If an investor can hold allocated precious metals while converting between gold and silver at relatively low cost, a larger portion of the movement in relative value survives the transaction.
Tax creates another potential friction. A conventional rotation may require an investor to sell one metal, realise a taxable gain where applicable, and then reinvest the remaining proceeds into the other. Goldwise is currently exploring whether fractional holdings could be converted into physical coins and bars, and potentially between metals, without requiring the investor first to sell the position. If implemented, that could make ratio-based strategies considerably more efficient from both a transaction-cost and tax perspective, depending on an investor’s individual circumstances.
A move from 100 to 50 is spectacular enough to overwhelm considerable friction. Most markets are less generous. Over years of smaller rotations, costs become part of the strategy itself.
Lower costs simply allow more of a successful rotation to survive the trade.
The Danger of Being Right Too Early
There is an appealing neatness to the worked example: buy silver at 100, switch back at 50, double the gold.
Markets are rarely so cooperative.
Suppose the ratio reaches 100 and an investor exchanges gold for silver. Instead of falling, it moves to 120 and remains between 120 and 150 for several years. The investor now owns an asset that has continued weakening relative to the gold they surrendered. Switching back crystallises the loss in ounces. Waiting requires patience without any guarantee that the old relationship returns.
Historical ratios are better used as reference points than automatic trading signals. Investors might stagger conversions rather than switching an entire holding at once, or maintain permanent core holdings while using a smaller allocation for tactical exchanges.
The objective remains simple: finish with more ounces than you started with.
If you are thinking about how to protect your wealth in this environment, you can explore physical gold and silver through www.goldwise.com, where the focus is on ownership, security and transparency.
Goldwise are committed to producing educational content that helps investors better understand the macroeconomic forces shaping financial markets. If there are topics you would like us to explore in future editions, we welcome your feedback.
Disclosure: Mr. Matthew Oliver, Oliver Market Intelligence, is a shareholder in Goldwise. Any opinions, analysis and views expressed in this publication are solely those of Mr. Matthew Oliver and Oliver Market Intelligence and are provided independently unless expressly stated otherwise.
This publication is provided for informational and educational purposes only and does not constitute financial, investment or other professional advice. References to Goldwise are for informational purposes and should not be construed as a recommendation to purchase any product or service. Investments can fall as well as rise in value, and readers should conduct their own research and, where appropriate, seek advice from a qualified financial adviser before making any financial decisions.